

“Your dashboards are green, but transactions are failing. Discover how enterprise observability transforms telemetry (metrics, logs, and distributed traces) into actionable business outcomes, rapid incident resolution, and cloud cost control.”
Your application is running. Your servers are healthy. Your monitoring dashboards are green.
Yet, customers are experiencing slow response times, transactions are failing intermittently, and your team is struggling to identify the cause.
What is happening behind the scenes?
In today's digital-first business environment, keeping systems online is only part of the challenge. Modern engineering organizations must understand how their applications actually perform, where failures originate across distributed dependencies, and how technical friction directly affects day-to-day operations.
This is where observability becomes essential.
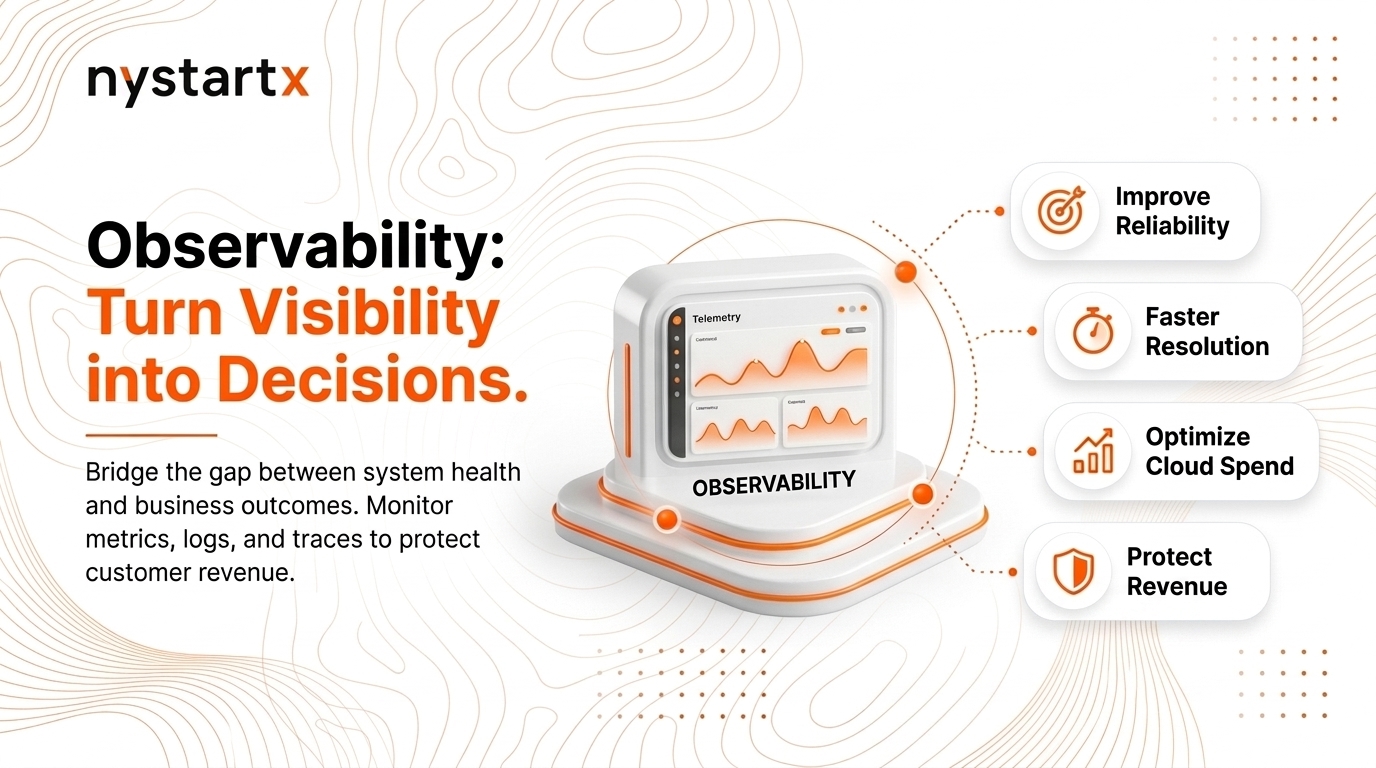
Observability provides granular visibility into cloud applications, microservices, and third-party dependencies, empowering engineering and leadership teams to identify anomalies, investigate their root causes, and make informed operational decisions.
More importantly, it connects technical infrastructure metrics with measurable business outcomes: from safeguarding customer experiences to controlling cloud infrastructure expenditure.
The Hidden Business Cost of Limited Visibility
Consider an e-commerce business during a major sales campaign or peak traffic event.
The website remains accessible, and server CPU and memory utilization appear normal. However, checkout API requests are taking several seconds longer than usual. Frustrated customers abandon their carts, support ticket queues spike, and potential sales evaporate in real time.
The infrastructure appears healthy on a surface-level dashboard, but the commercial customer experience is deteriorating rapidly.
Without cohesive visibility across front-end applications, managed databases, third-party payment gateways, and container networks, isolating the underlying bottleneck can take hours of stressful triage.
The consequences extend far beyond technical troubleshooting:
- Lost revenue: Slow or unreliable checkout journeys directly degrade transaction conversion rates.
- Operational inefficiency: Senior engineering squads spend valuable sprint time in war-rooms investigating issues without actionable diagnostic data.
- Customer dissatisfaction: Repeated, unpredictable latency spikes undermine user trust and damage brand reputation.
- Escalating cloud costs: Lack of visibility makes resource over-provisioning, unindexed database queries, and redundant workloads difficult to identify.
- Increased business risk: Undetected downstream failures jeopardize enterprise SLA guarantees and partner integrations.
The core challenge is rarely that systems fail completely. Far more often, the real problem is operating without the contextual signals needed to understand why performance is degrading.
From Monitoring to Observability
Traditional monitoring tracks predefined metrics and triggers threshold alerts when a server or CPU crosses an expected boundary. It answers the fundamental question: Is the system currently working?
Observability goes further. It empowers teams to debug novel, unexpected failure modes that were not anticipated in advance. It answers: Why is the system behaving this way, and which users or services are affected?
Three foundational signals make this possible:
1. Metrics: Understanding System Performance
Metrics provide quantitative, aggregated numerical measurements over time, including response latency percentiles (p50, p95, p99), HTTP error rates (4xx/5xx), request throughput, memory pressure, and CPU saturation. They help teams identify macro-level anomalies and evaluate performance trends.
# Prometheus PromQL: Evaluating P99 Latency Across Distributed Services
histogram_quantile(0.99, sum(rate(http_request_duration_seconds_bucket[5m])) by (le, service_name))
2. Logs: Contextual Event Records
Structured JSON logs record discrete, timestamped events generated by applications and runtime environments. They provide crucial contextual details (user identifiers, transaction IDs, stack traces, and payload signatures) necessary for auditing failed payments, authentication errors, or unhandled exceptions.
3. Distributed Traces: Visualizing Request Journeys
Distributed tracing tracks a single user request as it traverses across API gateways, service meshes, message queues (Kafka/SQS), and multi-region databases. Traces uncover the exact microservice span or database lock responsible for end-to-end latency.
When metrics, structured logs, and distributed traces are correlated under a unified standard, engineering teams can pivot directly from a high-level latency alert to the specific trace span and associated logs in seconds.
Why Observability Matters for Business Operations
Observability is not simply about collecting technical data or building impressive dashboards. Its real value lies in helping organizations maintain reliable customer services and make evidence-based operational decisions.
Improve Service Reliability & SLA Compliance
A platform can report 99.9% host uptime while mission-critical checkout workflows silently fail. Observability surfaces anomalies affecting high-priority customer transactions before they cascade into major operational incidents.
Reduce Mean Time to Resolution (MTTR)
Correlated telemetry eliminates guesswork and cross-team debate between infrastructure, platform, and application squads. Having traceable diagnostic data cuts mean time to detect (MTTD) and mean time to recovery (MTTR) from hours down to minutes.
Gain Evidence-Based Control Over Cloud Spending
Deep infrastructure visibility highlights idle workloads, oversized container instances, excessive log retention, and unindexed database queries. Teams can execute targeted FinOps optimization initiatives backed by verified usage data rather than guesswork.
Make Operational Performance Measurable
Tracking telemetry-backed Service Level Objectives (SLOs) and Error Budgets provides leadership with clear data on whether engineering deployment velocity is impacting system stability over time.
Protect Customer Experience & Digital Revenue
By actively monitoring real user journeys (RUM) and synthetic transaction checks, teams detect degradation before customers encounter broken workflows or submit support tickets.
Building an Effective Observability Strategy
A successful observability strategy does not begin with purchasing expensive enterprise software. It begins by aligning telemetry collection with strategic business priorities.
- 1. Map Critical Business Paths: Identify high-value transactions that generate revenue, such as customer signups, checkout pipelines, payment webhooks, and core public APIs.
- 2. Standardize Telemetry with OpenTelemetry (OTel): Instrument applications using vendor-neutral OpenTelemetry SDKs and collectors. This prevents proprietary lock-in and decouples code from third-party monitoring vendors.
- 3. Establish Centralized, Correlated Dashboards: Collect metrics, logs, and traces into centralized tools (such as Grafana, Prometheus, or AWS CloudWatch) where engineers can navigate smoothly from alert to trace.
- 4. Configure Actionable, Symptom-Based Alerts: Prioritize alerts that indicate genuine user-facing degradation (such as elevated error rates or SLA latency breaches) rather than noisy server-level spikes.
- 5. Manage Telemetry Costs & Data Retention: Apply intelligent tail sampling, structured log filtering, and tiered metric retention policies to avoid runaway monitoring ingestion bills.
- 6. Review and Improve Continuously: Conduct blameless incident reviews using traces and logs as objective evidence. Continuously refine architecture and SLO targets based on production findings.
Measuring the Business Value of Observability
Observability delivers return on investment (ROI) when it drives tangible operational and financial improvements rather than simply producing more charts.
| Business Objective | Key Operational Metric & KPI |
|---|---|
| Improve Service Continuity | High Availability (99.99%) & Customer-Impacting Downtime |
| Resolve Incidents Faster | Mean Time to Detect (MTTD) & Mean Time to Recover (MTTR) |
| Protect Customer Experience | Transaction Success Rate & P95/P99 Response Latency |
| Optimize Infrastructure Spending | Cloud Infrastructure Cost per Active Transaction / Workload |
| Improve Operational Efficiency | Reduction in On-Call Alert Fatigue & Unplanned Triage Hours |
| Strengthen Governance | Service-Level Objective (SLO) & Error Budget Attainment |
These measurements help organizations evaluate whether their monitoring investment is genuinely improving reliability and operational efficiency. Meaningful improvements should always be measured against an established baseline rather than assumed to deliver automatic savings.
Building Reliable, Cost-Efficient Systems with NystartX
At nystartx, our engineering approach focuses on connecting infrastructure reliability directly to business outcomes.
We build production-grade observability architectures across AWS Cloud, Salesforce integrations, and distributed Kubernetes clusters. By leveraging OpenTelemetry, Prometheus, Grafana, and cloud-native logging pipelines, our engineers help teams uncover hidden bottlenecks, prevent service degradation, and maintain stable cloud infrastructure.
A successful observability implementation does not require buying the most expensive enterprise suite or managing dozens of disconnected dashboards. It requires practical instrumentation tailored to your specific application architecture, operational priorities, and cost constraints.
Final Thoughts
As organizations become increasingly reliant on digital services, understanding internal system behavior is just as critical as keeping servers powered on.
Observability bridges the gap between infrastructure metrics and business performance. It equips decision-makers with the actionable insight needed to protect user trust, streamline cloud expenditure, and scale with confidence.
Better visibility leads to better decisions, and better decisions build more resilient, profitable businesses.
If your team is working to improve system visibility across cloud applications, nystartx can help design and implement a practical observability framework tailored to your architecture and operational goals.
Related Engineering Blueprints
AWS WAF: What It Costs and When You Actually Need It
AWS WAF is often treated as a standard production checkbox. Explore real-world pricing dimensions, traffic-based cost profiles, and when it is genuinely justified in enterprise architectures.
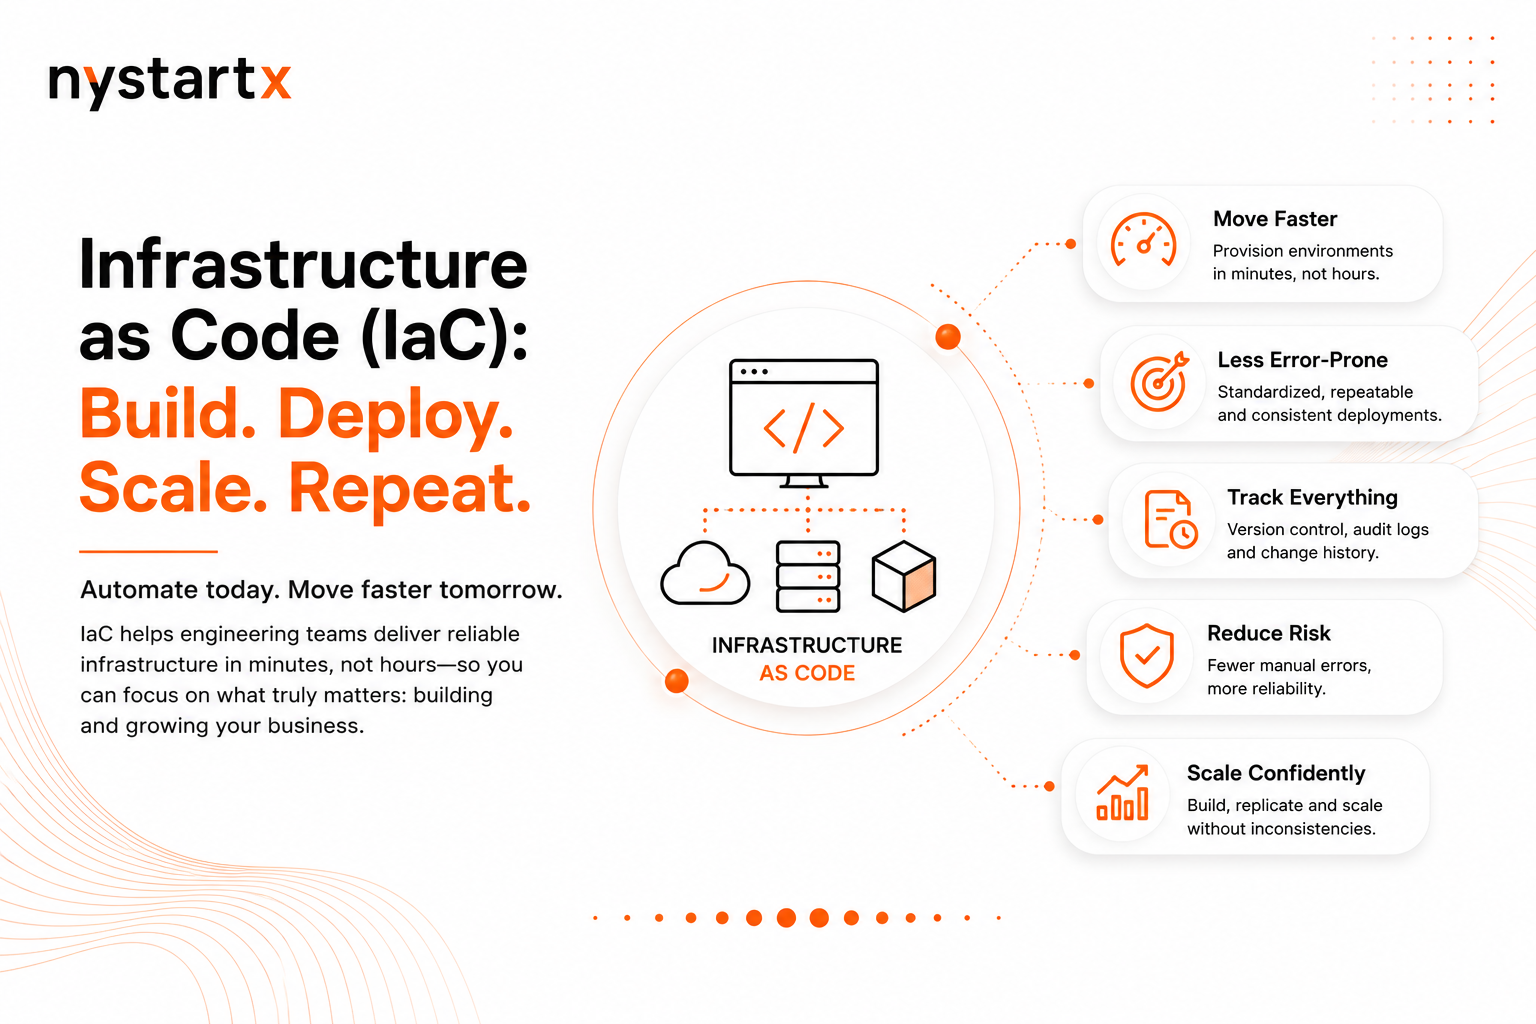
Infrastructure as Code: The End of Manual Cloud Provisioning
As businesses grow, infrastructure complexity grows with them. Infrastructure as Code changes the game by making deployments consistent, repeatable, and fully version controlled: so your teams spend less time fixing environments and more time shipping.
Schedule a direct technical consultation with our engineering team.
Direct access to experienced technical leads. No sales pressure, just rigorous architectural review of your cloud infrastructure, Salesforce org, or application roadmap.